
Grain markets give retreat from the highs yesterday, taking prices back to support. A big focus will continue to be on the Crop Tour.
Our Crop Tour route for today starts in Wabash County Indiana and will work west into Illinois. Get all of our Crop Tour email updates by signing up here:Crop Tour (bluelinefutures.com
| Corn Technicals (December) December corn futures ripped higher in the Sunday night trade but that optimism fizzled out through yesterday’s session, taking prices back into support. There’s nothing Bullish about yesterday’s reversal as far as the charts go. The Bulls need to defend 472-476 to prevent a further decline in prices. News The Pro Farmer Crop Tour released their findings from Day 1 yesterday, showing an average yield for Ohio at 183.94, that is up from last year’s average of 174.17 and up from the 2020-2022 average of 175.64. On the Western side of the tour they showed an average yield for South Dakota at 157.42. That’s sharply higher than last year which was expected due to extreme stress basically the whole way through the growing season. The 2020-2022 average for that area is 149.71. Today’s eastern tour will cover the second half of Indiana and work into Illinois. There was a flash-sale reported yesterday morning: 111,770 metric tons (4,400,189 bushels) of corn for delivery to Mexico during the 2023/2024 marketing year Bias: Bullish/Neutral Previous Session Bias: Neutral/Bullish Resistance: 502-506 1/2***, 518-525 3/4**** Pivot: 480-482 Support: 472-476****, 460-464 1/2** 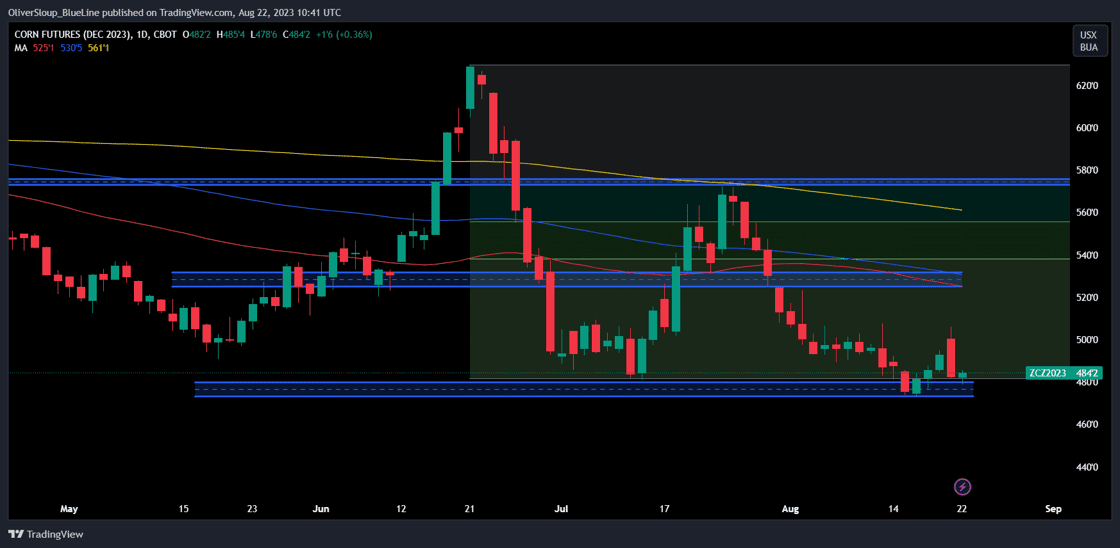 Seasonal Tendencies Seasonal TendenciesBelow is a look at seasonal averages for December corn. The 5-year seasonal average suggests seasonal consolidation while longer term averages continue to trend lower. 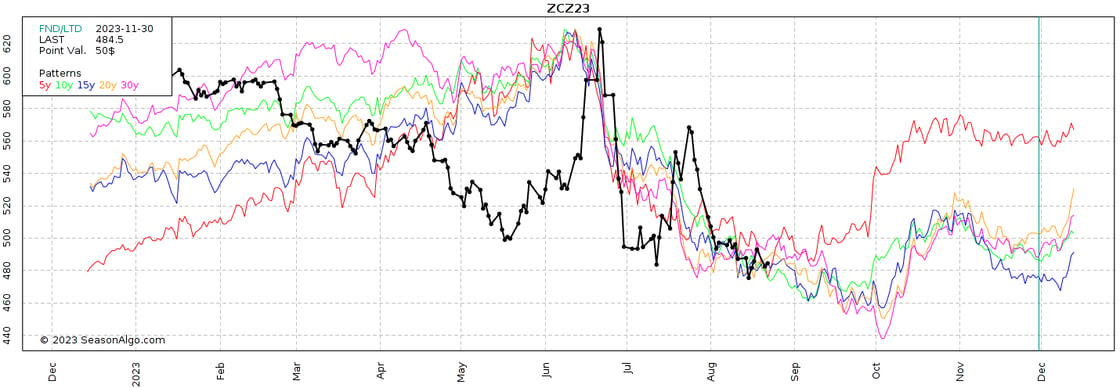 Soybeans Soybeans Technicals (November) Near term upside targets for soybeans were achieved yesterday, filling the gap from July 31st. Whether or not the market can break out above here could be dependent on this week’s weather and the Pro Farmer Crop Tour findings. If the Bulls can chew through 1373 1/2-1381 we could see an extension above $14.00 with a retest of the July highs in the cards, which comes in near 1425. A failure to take out this week’s high could lead to consolidation and a retracement to the 50 and 200 day moving averages which come in from 1332-1338 News Day 1 of the Pro Farmer Crop Tour showed pod counts in Ohio at 1252.93, that’s up from last year’s 1131.64 and up from the 2020-2022 average of 1160.9. Pod counts in South Dakota were reported at 1013, up sharply from last year (as expected) but below the 2020-2022 average of 1039.71. There was a flash-sale reported yesterday morning: 159,350 metric tons (5,855,108 bushels) of soybeans for delivery to unknown destinations during the 2023/2024 marketing year. Bias: Bullish/Neutral Previous Session Bias: Bullish/Neutral Resistance: 1324-1334***, 1350-1355** Pivot: 1291-1300 Support: 1282**, 1256-1260*** 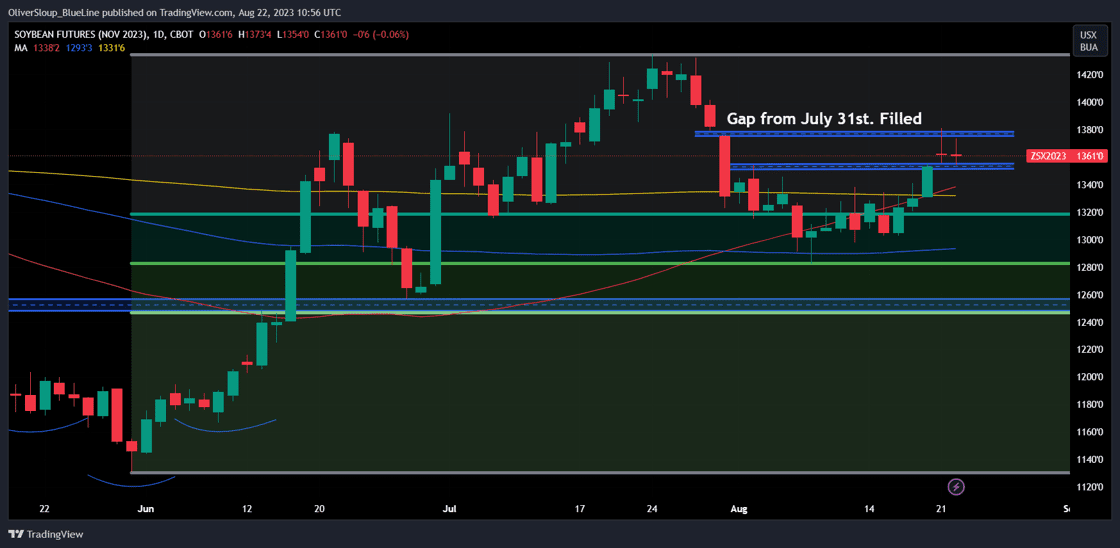 Seasonal Tendencies Seasonal TendenciesBelow is a look at seasonal averages for November soybeans. 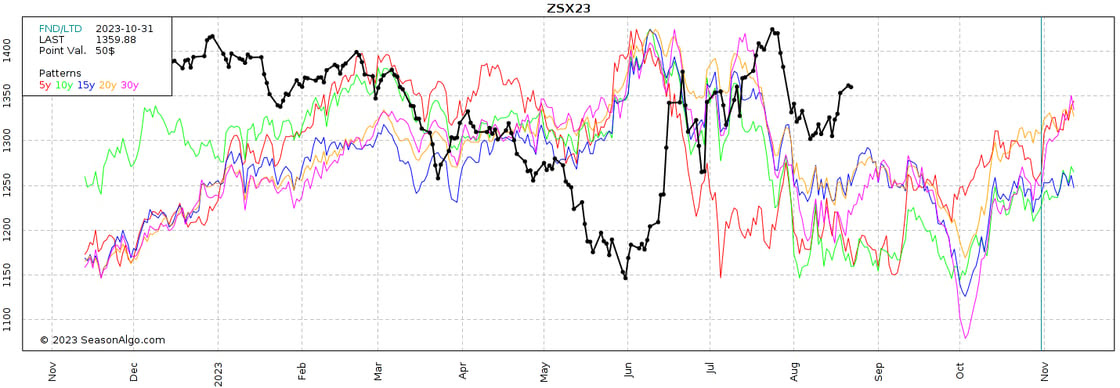 |