
A choppy trade in the overnight and early morning session for corn and soybeans. A “traders paradise”?
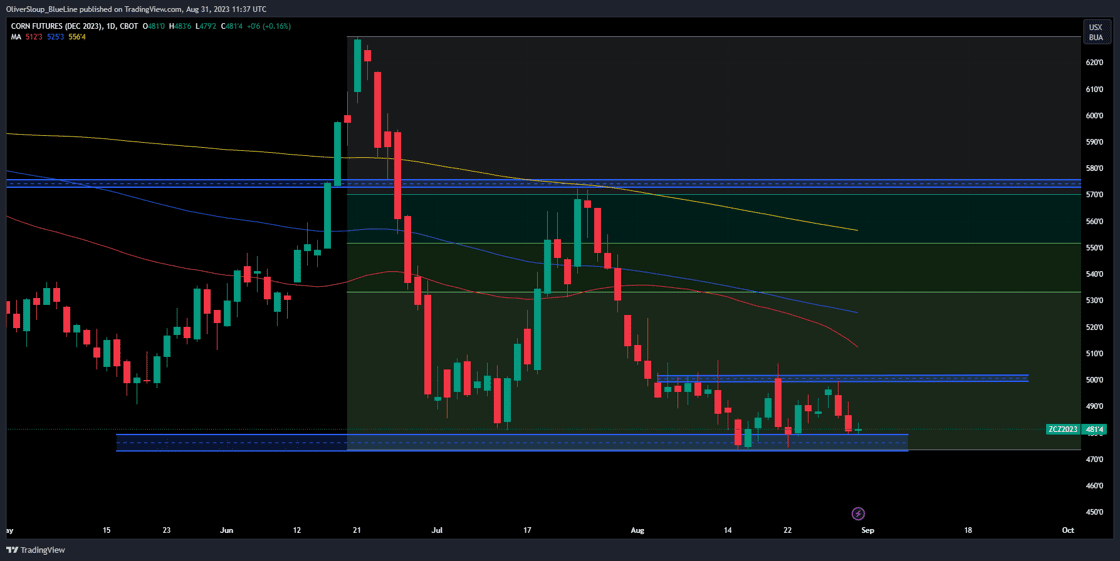
| Corn News Water levels on the Mighty Mississippi continue to be on the decline, posting the second lowest level on record for August 29th. This has stated to impact barge rates and basis. Hot and dry forecasts through the first week of September do not help this issue. Weekly export sales for new crop corn are expected to come in from 400,000-1,100,000 metric tons. Last week’s was reported at 673,499 metric tons. Text “Alerts” to 888-839-7631 to receive news alerts.Technicals (December)December corn futures attempted to rally yesterday but fell flat into the afternoon session, closing near the lows of the day. 472-476 is the support pocket the Bulls must defend. A break and close below that pocket could accelerate the selling pressure. On the flip side, 489-491 is our pivot pocket. If the Bulls can muster up the energy to get out and close above this pocket it could reinvigorate buyers and take us back towards the upper end of the recent range, 502-506 1/2. As mentioned in yesterday’s commentary, we wouldn’t be surprised to see a choppy sideways trade in the near term. Not a great environment for perma-bulls or perma-bears, but great for shorter term trading opportunities on both sides of the market. Bias: Neutral Resistance: 497 1/2**, 502-506 1/2***, 518-525 3/4**** Pivot: 489-491 Support: 472-476****, 460-464 1/2** |
 |
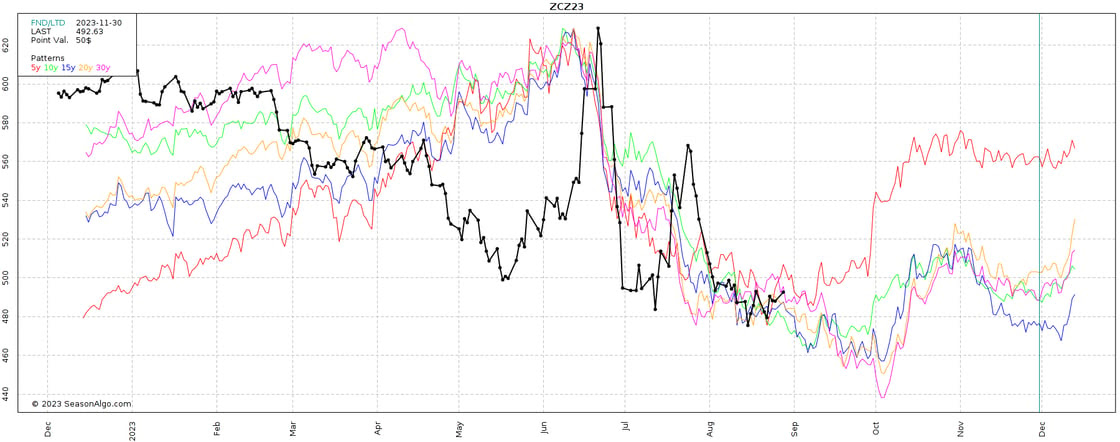
| Seasonal Tendencies Below is a look at seasonal averages for December corn. The 5-year seasonal average suggests seasonal consolidation while longer term averages continue to trend lower into harvest. |
 |
| Soybeans News |
| Water levels on the Mighty Mississippi continue to be on the decline, posting the second lowest level on record for August 29th. This has stated to impact barge rates and basis. Hot and dry forecasts through the first week of September do not help this issue. Soybeans were lower overnight but heading towards their biggest monthly gain since February last year, supported by improving U.S. export demand and fears that dry weather was damaging the crop at a key stage of development. -ReutersTraders estimated U.S. soybean export sales for the week ended Aug. 24 in the range of 650,000 to 1.7 million metric tons. Last week’s was reported at 1,218,168 metric tons. Text “Alerts” to 888-839-7631 to receive news alerts.Technicals (November)November soybeans traded lower yesterday and overnight, testing and defending our 4-star support pocket from 1373-1381. This pocket represents previously important price points including the old gap from July 31st. From a risk/reward perspective, we feel this pocket represents a good opportunity to the buy-side, whether that be initiating longs or covering shorts. A break and close below that pocket would neutralize that bias as it could open the door for long liquidation and a retest of trendline support and two major moving averages. A close back above 1390 1/2-1392 could be what reinvigorates the Bull camp. Bias: Bullish/Neutral Resistance: 1409 1/2**, 1428-1435**** Pivot: 1390 1/2-1392 Support: 1373-1381****, 1350-1355*** |
 |
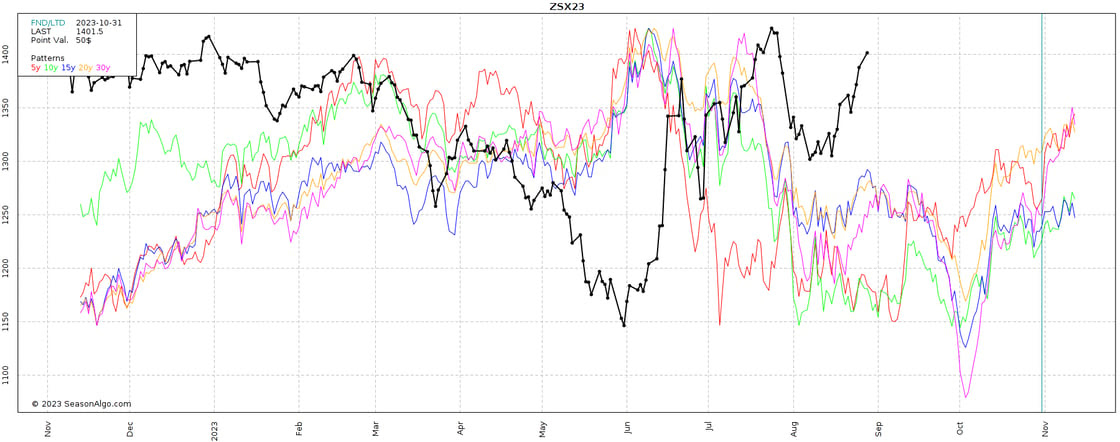
| Seasonal Tendencies Below is a look at seasonal averages for November soybeans. We’ve noted in previous reports that seasonal tendencies suggest this is a time of year where the market attempts to consolidate and carve out a near term low. |
 |
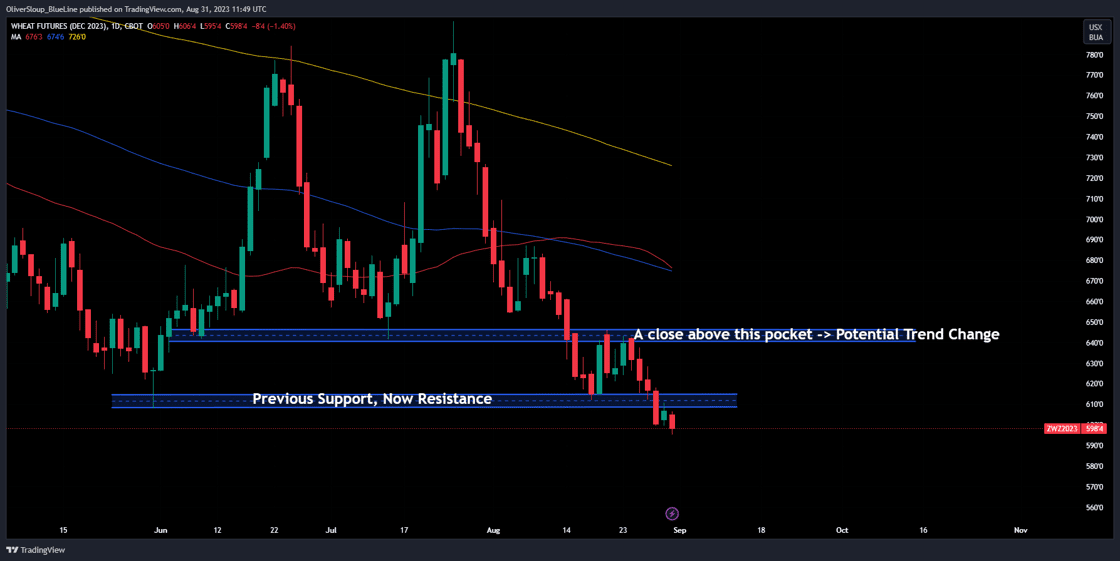
| Wheat News Chicago wheat fell more than 1.5% on Thursday morning and was on track for a monthly fall of 10%, its biggest since May 2022, amid plentiful supplies from top exporter Russia. -ReutersWeekly export sales are expected to come in from 250,000-700,000 metric tons. Last week’s came in at 405,986 metric tons. Text “Alerts” to 888-839-7631 to receive news alerts. Technicals (December)Wheat futures are higher in yesterday’s trade but have given it back and made new lows in the early morning trade. The market has been under enormous amount of pressure since marking a double top back on July 25th. In those following 25 trading sessions wheat fell as much as $1.78 with very few attempts at a relief rally in-between. Despite the persistent selling pressure, the RSI (relative strength index) never dipped below 30 on the daily chart, which is the line in the sand that most technicians use when referencing “oversold”. It appears that seasonality has outweighed concerns over global production and potential logistical issues. This years price action aligns pretty closely with what we’ve seen on the 10, 15, and 20 year average price charts. Those seasonal averages suggest that a seasonal low wouldn’t come into play until the first week of September. Looking at a more recent 5-year seasonal average price chart, we see that the wheat market has been fishing for a bottom and consolidating a week or two earlier. What does it all mean? I’ve always been a big believer that the bottom is a process and not necessarily a point. With that in mind, that process could be in the process of beginning. A close back above previous support from 608-612 could confirm that bias and encourage further buying via (Fund) short covering or “bargain buyers”. The next upside objective above that pocket would be 641-646. Bias: Neutral/Bullish Resistance: 643 1/2-646 1/4****, 677 1/4-682 1/4*** Pivot: 608 1/4-612 Support: 595-599 1/2** |
 |
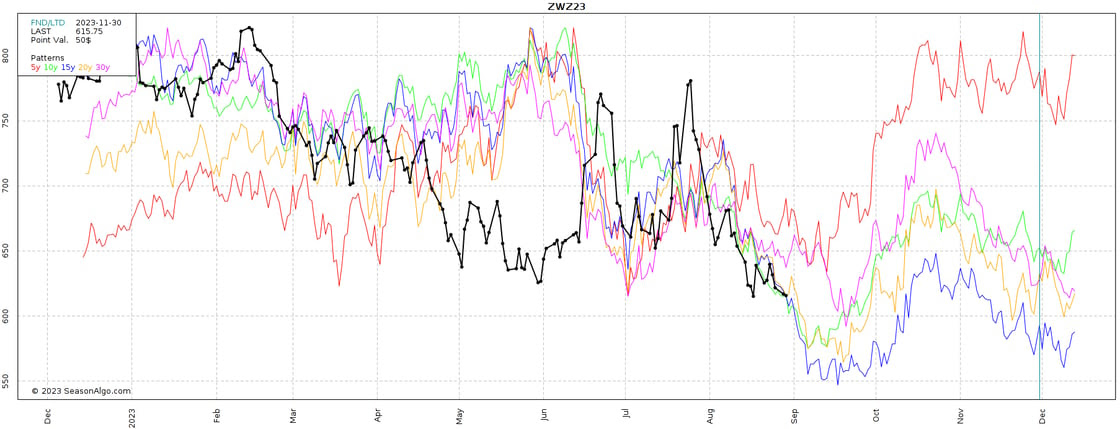
| Seasonal Tendencies Below is a look at seasonal averages for December Chicago wheat. The market is tracking the 15-year average the most closely (blue line), which suggests lower into the middle of September. The more recent 5-year average (red line) shows that consolidation has been happening earlier, which may help the market start to carve out a low against that May 31st low, 608 1/4. |
 |